
By Peter Gorham, FCIA, Actuary, JDM Actuarial Expert Services
Normally it is only those practising in actuarial evidence who take note of a new Canada life table. But this year, it may be prudent for all actuaries to give it at least some thought.
Statistics Canada released the Canada life tables for 2018 to 2020 this past week and for the first time, it includes mortality tables for individual years as well as the traditional three-year average rates. Life expectancy for a newborn decreased by more than half a year – from 82.29 in 2019 to 81.72 in 2020. There was no comment about what effects COVID-19 had on that decrease.
Three days later, the Society of Actuaries (SOA) released a research paper looking at US population mortality in 2020. The authors split the 2020 mortality between COVID-19 and all other deaths. They found that US mortality worsened in 2020 even without the effect of COVID-19. Combined US mortality rates excluding COVID-19 worsened by 4.9% in 2020, the largest year-over-year mortality increase in the US since 1936.
US mortality rates including COVID-19 worsened in 2020 by 16.8% (compared to a 1.2% improvement in 2019) which exceeded the 11.7% worsening in 1918 during the Spanish Flu.
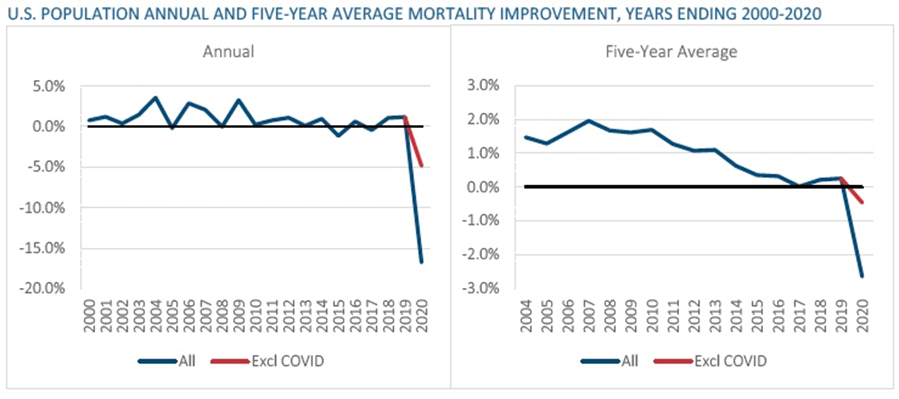
The worsening of US mortality excluding COVID-19 cut across almost all age groups – females under age 15 and males under the age of one were the only groups with an improvement. And most causes of death that were analyzed also showed a worsening – only cancer, pulmonary diseases, and suicide showed an improvement in mortality in 2020.
What about Canada?
Using the Canada Life Tables for individual years from Statistics Canada, I calculated an age-adjusted mortality rate for Canada (based on 2011 population – the same basis used in the SOA research paper). Over the 20 years between 2001 and 2020, there were only three years where combined mortality worsened – 2007, 2017, and 2020, with the negative for 2007 disappearing with rounding.
Statistics Canada separately issued data on cause of death for 2000 to 2020. When I excluded COVID-19 deaths, Canadian mortality improved by 2.2% in 2020. A stark contrast to the US experience.
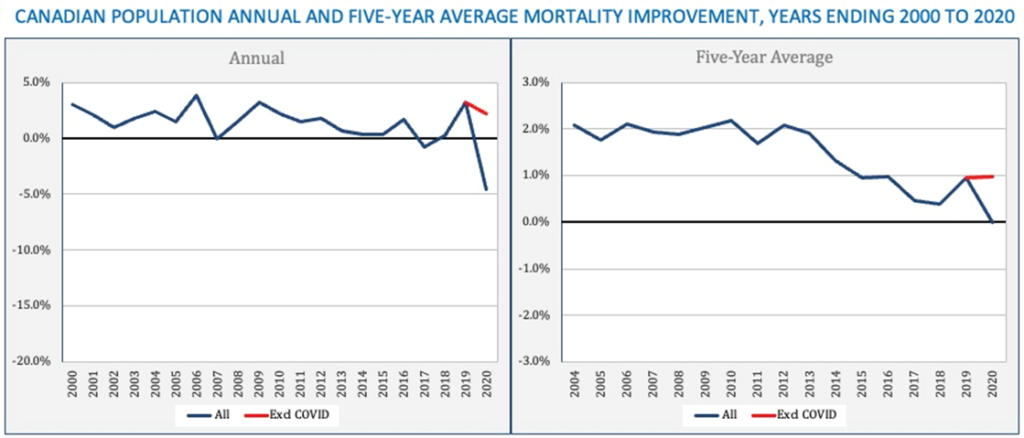
From 2000 to 2020, mortality improvements (excluding COVID-19) have been greatest among males – an annual average of 1.8% for males, 1.4% for females, and 1.6% combined. But that may be changing as in six of the past nine years, female improvements have been greater than male improvements (although the six-year average is roughly the same at 1.1% annually).
Hidden in the details of the Canadian data are some big differences by age. Excluding COVID-19, mortality worsened for ages 18 to 69 for both sexes. That’s a lot of people experiencing worsening mortality – but because there are relatively fewer deaths at those ages, they contribute slightly less to the age-adjusted mortality rate than do those above age 70.
There are some notable comparisons between our two countries:
- The 2020 mortality rate from COVID-19 in Canada was under half of the US rate – 42.5 deaths per 100,000 Canadians compared with 91.3 deaths per 100,000 Americans.
- Canadian mortality improvements have greater volatility than the US. I presume that is mainly due to the US having roughly 10 times the number of data points compared with Canada. The Canadian results will contain more noise.
- Canadian mortality over the past 20-years has improved noticeably more than US mortality. And when we get into the causes of death, (the subject of another Seeing Beyond Risk article) there are some startling (at least to me) differences.
- In 2020, mortality excluding COVID-19 worsened at roughly the same rate in Canada and the US between ages 18 and 55. At older ages, the Canadian mortality improved and US mortality worsened. At younger ages, the results appear to be influenced by rounding and I decided to avoid drawing any conclusions.
What are your thoughts on the latest life tables and the overall worsening of mortality rates? Leave a comment sharing your thoughts below.
Stay tuned for an article later this week on the cause of death in 2020.
The Canada life tables for 1980 to 2020 can be found at Statistics Canada: https://www150.statcan.gc.ca/n1/pub/84-537-x/84-537-x2021001-eng.htm
The cause of death for Canada 2000 to 2020 can be found at Statistics Canada: https://www150.statcan.gc.ca/t1/tbl1/en/tv.action?pid=1310039401
The SOA research paper U.S. Population Mortality Observations can be found on the SOA website: https://www.soa.org/resources/research-reports/2022/us-population-mortality/
This article reflects the opinion of the author and does not represent an official statement of the CIA.