
By Kai Kaufhold
Setting the stage
In 2020 the CIA formed a project oversight group (POG) to commission research on mortality improvements in Canada which could become the basis for a new mortality projection scale to be used by all actuarial practice areas. In its request for proposal, the POG emphasized that the research should consider international best practices and incorporate a review of existing mortality projection methods and models. Furthermore, the POG requested that researchers consider a general framework for updating mortality improvement assumptions regularly.
Having gained more than a decade of experience in longevity modelling within the pension risk transfer markets in the UK and Canada, consulting firm Ad Res teamed up with researchers from the Koblenz University of Applied Sciences who had just completed a research project comparing a wide variety of mortality models. We launched the research project in early 2021 and worked in close collaboration with the POG throughout the entire duration of the project, from spring 2021 to fall 2023.
Which key findings can actuaries take away from the research report published in April 2024?
- Mortality improvement (MI) rates are highly volatile, requiring statistical models to analyze the observed mortality experience. Canadian population mortality data shows clear patterns by age, period and by year-of-birth cohort, which all must be accounted for when projecting mortality rates into the future.
- The research team and POG selected the most suitable statistical model from an extensive list of candidate models based on goodness of fit and robustness, which means that the selected model captures the key features of mortality trends observed in the Canadian data and that results should not be sensitive to changing the data range – or other model choices.
- The research team developed a model framework based on the so-called CMI Model[1], which allows us to reconcile the results of a stochastic mortality model with a deterministic long-term MI rate giving consistent results.
- Calibrating the stochastic age-period-cohort mortality model on Canadian population data from 1980 to 2019 delivers an average unisex long-term MI rate of 1.3% per year for ages 40 to 90, setting in from 2050.
- Controlling for period and cohort effects, the 40-year observation period turns out to deliver the lowest long-term MI rate. Both shorter and longer data ranges would imply higher average rates.
Research process
The CIA MI research project had several key objectives which are summarized in the published report:
- Extensive literature review
- Review of available data sources
- Implementing shortlisted mortality models
- Developing a deterministic mortality projection framework like the CMI method
- Scenario testing
For each research objective, the research team and the POG had multiple meetings to present preliminary results, for further discussion and then for confirmation of the respective deliverable.
Literature review
The literature review covered a substantial list of academic publications as well as working papers and research publications by other actuarial associations, such as the Society of Actuaries (SOA) and the Institute and Faculty of Actuaries (IFoA). The key objective was to gain an overview of the current body of knowledge and to decide the scope of our investigations. Among the models and methodologies which we decided to exclude were multi-population mortality models which simultaneously project the trends for different subpopulations coherently. This class of model is important when trying to understand how mortality trends for various socio-economic groups differ. Likewise, analyzing the contributions of the different causes of death to mortality trends was deferred to further research. Similarly, we decided against implementing Bayesian mortality projection models which can be extremely resource intensive. These would be interesting for a follow-up project investigating risk margins and uncertainty of MI rates.
Data sources
As data sources, we had the choice of data from the Canada Pension Plan and Québec Pension Plan, data from Old Age Security, life insurance data collected by the CIA and population-level data. We selected Canadian population data published by the Human Mortality Database Project (HMD) because it provides the most consistent set of data over the complete age range and a long historical period (1921 to 2019 at the time).
Model implementation
After our literature review, we were left with a shortlist of 14 mortality models, covering stochastic models for both mortality rates and mortality improvement rates, from the class of generalized age period cohort models.
The simplest such model, the so-called “APC” or Age-Period-Cohort model, and the Integrated Age-Period-Cohort or “APCI” model turned out to be the most robust models which captured all characteristic patterns within the data. The main difference between these two models is that the APCI model explicitly describes the age component of mortality improvements as a linear time process, while the APC model allows the user to freely choose the time-series process for projecting future mortality rates.
On the other hand, the APC model implies that mortality rates improve uniformly across all ages once the cohort component has been subtracted. In summary, both models which we found suitable include strong simplifying assumptions. Remember that models always represent a trade-off between simplicity and goodness of fit, which means that it is important to test a variety of models.
Setting the long-term MI rate
Besides stochastic mortality models, which are most prevalent in academic studies, international actuarial practitioners also use deterministic projection models. Prominent examples are the SOA, whose Longevity and Mortality Strategic Research Program published a mortality improvement model (MIM) based on historical data from the United States Social Security Administration, and the IFoA’s Continuous Mortality Investigation which has published a series of projection models, the so-called CMI Models.
In our work, we used a variant of the CMI method to decompose recent mortality improvement trends into age, period and cohort components. This is done using the APCI model, which lends itself particularly well to that task. Each of the components is then projected into the future. Our main assumptions are that:
- Period effects are temporary fluctuations around the linear trend implied by the APCI model, so they can well be modelled using a random walk; and
- Cohort effects are also best modelled using a stationary process with no long-term MI contribution from the cohort component.
In other words, we set the long-term MI rates for both period and cohort components to zero. This leaves the age component as the only contributor to any long-term MI rates. After a convergence period of 30 years, we assume a single, age-independent MI rate.
Figure 1: Illustration of stochastic and deterministic MI rates
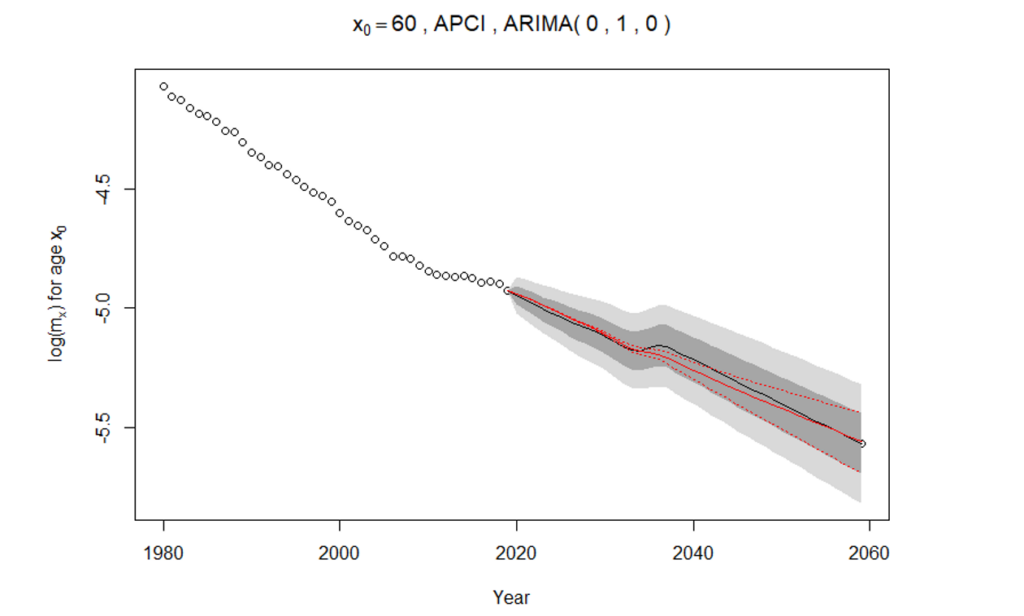
Rather than subjectively choosing a rate using expert input, we determine which long-term MI rate would be consistent with the median result of our stochastic mortality forecast from either the APCI or the APC projection model.
This is illustrated in Figure 1, which shows historical and future mortality rates for 60-year-old males on a logarithmic scale. The circles represent log mortality rates from 1980 to 2019. The gray areas represent confidence bands for the stochastic mortality forecast, with the median forecast given as a solid black line. The solid red line represents the deterministic MI projection which is found by minimising the square errors between deterministic projection and median stochastic forecast.
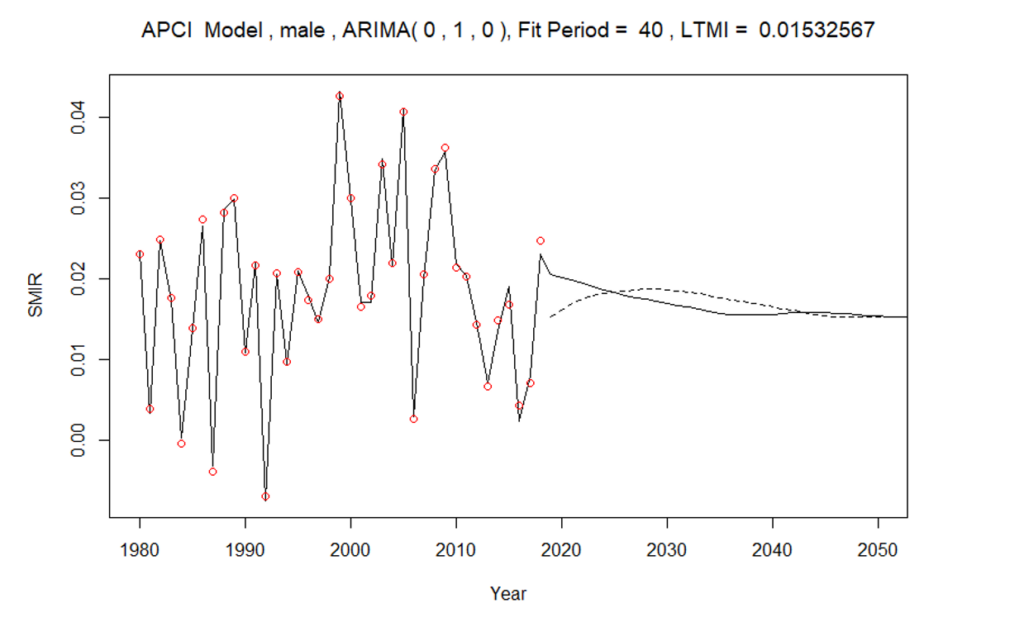
Figure 2 shows age-standardized mortality improvement rates, both historical (red circles) and modelled (solid line). The deterministic projection à la CMI is illustrated by the dashed line, indicating both the lower jump-off point, relative to the 2019 MI rate, and the gradual convergence to a long-term rate over 30 years. Note that in the final implementation of the CMI projection for the proposed best estimate, we have removed the apparent increase in projected MI rates between 2020 and 2030. Please refer to the report for details.
Figure 2: Standardized mortality improvement rates – male
For the APCI model, the equivalent long-term MI rate is between 1.4% and 1.5%, when taking the average of male and female MI rates. As mentioned above, the APCI model implies a linear MI trend for the age component. When choosing the random walk with drift for the APC model, our runner-up candidate model, we get the same result. In other words, the drift term in the random walk delivers the same result as the linear APCI assumption. However, if we choose a higher-order time series process, the ARIMA(1,2,1) model, the long-term MI rate for males turns out to be less than that for females, which was 1.3%. For this reason, our recommended best-estimate long-term MI rates, applied within the adapted CMI method described in our report, is 1.3%.
Considering both stochastic uncertainty and estimation error, we find that the reasonable range within which a unisex long-term MI rate should lie is 1.0% to 1.9%, for ages 40 to 90 years applicable from 2050 onwards.
Scenario testing
The best-estimate projection scale, which we put forward to the POG in late 2022, has since been extensively tested. For each model choice made along the way, we considered which could have been reasonable alternative assumptions and tested their impact. This gives us a great deal of confidence that our best estimate is robust.
The choice with the largest impact on the final outcome naturally is the choice of data range, which is why we tested all possible other choices of study period. Details of these tests can be found in the report, but the most striking result was that the 40-year observation period which we had chosen because it provided a good balance between the most relevant recent data and a long enough historical period to confidently be able to extrapolate into the future, delivers the lowest average long-term MI rates of all reasonable choices.
Another important finding was that the choice of smoothing has a material impact on the overall result. For this reason, we took care to smooth as little as possible and to ensure that we retained the characteristics of the unsmoothed results. One important assumption that is worth calling out is that the model parameters describing period effects should not be smoothed, because we must expect mortality to vary from one calendar year to the next. Neighbouring ages and cohorts, by contrast, are expected to have smooth transitions in mortality rates and no jumps. Therefore, we apply a penalized log-likelihood approach to generate smooth parameter estimates for age and cohort parameters.
The research team also investigated the potential impact of COVID-19 on Canadian population mortality trends by disaggregating the age-banded weekly data on short-term mortality fluctuations provided by the HMD into deaths by individual year of age. Our review confirms emerging research findings that using calendar years 2020 or 2021 as a jump-off point for the time series projection would lead to distortions that would most likely not reflect the real underlying long-term mortality trend. Research published in 2021 and 2022 demonstrates that while the underlying trend is generally expected to be stable, the occurrence of a pandemic increases the level of uncertainty in mortality projections.
Conclusion and outlook
The key outcome of our research on mortality trends in Canada is a framework for setting mortality trend assumptions which can be readily applied to emerging data. Modelling all-cause mortality for Canadian males and females between ages 40 and 90 years, we investigated a wide range of candidate models with age, period and cohort components. The most suitable models according to goodness of fit and robustness, given the data, were the APCI and the APC models. The resulting stochastic forecasts from these models can be reconciled to a deterministic long-term MI rate in the style of the CMI Model, by finding the long-term rate which for the modelled age range gives the least mean square error.
Key limitations of the research have been that we did not model separate trends for different causes of death, and our single population modelling approach does not reflect different socio-economic groups which may experience different mortality trends. Furthermore, as more data emerges after the COVID-19 pandemic, it will make sense to extend the modelling framework to explicitly allow for mortality jumps.
We would encourage every practitioner whose work includes the application of mortality projections to test the proposed best-estimate rates provided with the published report. A detailed impact analysis was out of scope for the research project, but stakeholder groups within the CIA are working towards formulating recommendations.
In 2011, Kai Kaufhold established the actuarial consulting firm Ad Res. With over 25 years of experience in the life and health reinsurance sector, he provides consultancy services to reinsurers, life companies and pension plan administrators. His consultations cover a wide array of topics, including longevity risk, reinsurance pricing, mortality improvement assumptions and reinsurance strategy. For inquiries and comments, you may reach out to him at kai.kaufhold@adreservices.com.
This article reflects the opinion of the author and does not represent an official statement of the CIA.
[1] Named after the Continuous Mortality Investigation of the UK’s Institute and Faculty of Actuaries.