
By Yves Guérard, FCIA
In the lead-up to COP 26, along with companies, cities, and financial institutions, over 130 of the 191 parties to the Paris Agreement endorsed the objective of the global net-zero coalition to limit global warming to no more than 1.5 C, a more aggressive goal than the original Paris Agreement target of 2 C.
However, as Figure 1 shows, the Glasgow Climate Pact did not deliver the Paris Agreement 2.0 that many expected. The nationally determined contributions (NDCs) to emission reductions submitted at this first quinquennial mandatory update failed to meet even the 2 C goal, putting the world on a trajectory to 2.7 C above pre-industrial level.
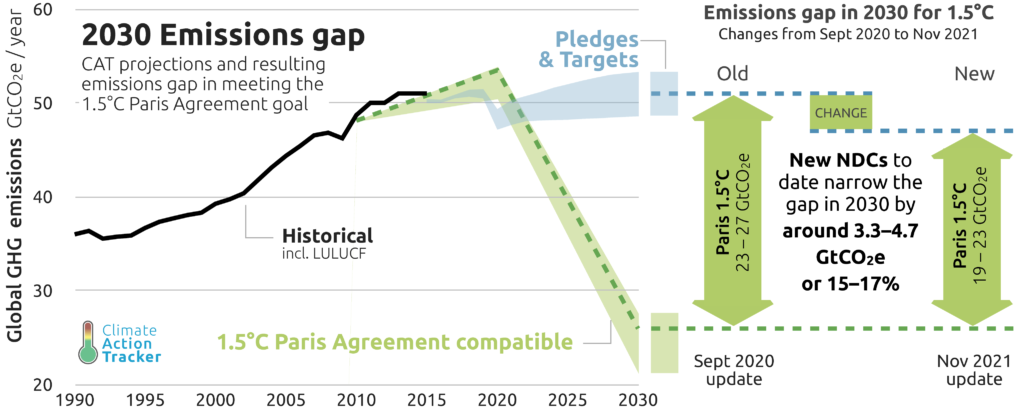
The Pact reaffirms the goal to keep global warming “well below 2 C above pre-industrial levels” (section IV paragraph 15) and resolves to “pursue efforts to limit the temperature increase to 1.5 C” (section IV paragraph 16) but the projected reduction in the gap barely reaches ±16% by 2030, instead of the 45% deemed necessary to achieve net zero by 2050. The fallback position for many parties became “to keep alive the 1.5 C goal” by calling again for an upgrade of the NDCs as soon as 2022, rather than waiting for the normal quinquennial review, thus raising the pressure on the COP 27 negotiations.
A few good surprises, but…
The Glasgow Pact contained a few positive additions. Section IV paragraph 20 “Calls upon Parties to accelerate … efforts towards the phasedown of unabated coal power and phase-out of inefficient fossil fuel subsidies, … recognizing the need for support towards a just transition.” It was the first time a COP agreement referred to fossil fuel – and explicitly to coal – rather than to generic greenhouse gas (GHG) emissions. It was a surprise in itself since this has been an objective since COP 15 in Copenhagen in 2009.
The surprise is mixed news: two words were added, “unabated” to qualify coal and “inefficient” for fossil fuel subsidies, while “phasedown” replaced a stronger “phase-out.” These last-minute changes, demanded by China and India, open the door to procrastination and weak commitments.
Was the lesson learned for COP 27?
These additions are the consequence of a self-imposed unanimity rule which makes it possible to claim a consensus of all signatories, with no abstention or negative vote. After many decades of hoping that GHG emissions would peak, they are still increasing as shown by in Figure 1 above.
Future COP negotiators should reconsider the unanimity rule that pulls down ambitions to the lowest common denominator, in favour of majority decisions where transparency would increase peer pressure on dissidents even though NDCs would remain voluntary commitments.
For now, the 1.5 C goal remains alive on paper only. Actuaries may assign a very low probability to that trajectory!
Climate justice
The concept of “climate justice,” injected at the very beginning of the Glasgow Pact, became a hot topic and will likely be a burning one at COP 27. Understanding this concept requires a short discussion of another basic concept: the carbon budget.
Since global warming is driven by increases in the concentration of carbon dioxide (CO2) and other GHGs in the atmosphere, limiting the warming to 1.5 C or 2 C means that a limited number of tons of CO2 can be emitted. By the end of 2019, 2,390 gigatons of CO2 had been emitted, and the world reached global warming of 1.07 C. The carbon budget, that is, the maximum number of tons that can be emitted as of 2020 while remaining compatible with the climate goal, varies according to the probability of achieving the objective.
According to the Intergovernmental Panel on Climate Change AR6 report, for a probability of 50%, the carbon budget compatible with a goal of 1.5 C is 500 gigatons, whereas if the goal is 2 C, it is 1,350 gigatons. For a lower risk and a better chance of success, say two-thirds, the carbon budgets are reduced to 400 gigatons and 1,150 gigatons, respectively. Intermediate values would apply for a goal of 1.7 C or 1.8 C.
For actuaries, the important number is a derivative of the carbon budget: the stranded assets are the part of fossil fuel reserves that are in excess of the carbon budget and thus should not be burned if the goal is to be achieved. This impacts their value as assets!
Countries that started to burn fossil fuels decades ago to develop their economy are responsible for the bulk of past emissions: climate justice is about how to share the remaining carbon budget.
Current emissions running at about 45 gigatons/year means that for a fifty-fifty probability of success in limiting global warming to 1.5 C, the 500 gigatons would be exhausted in less than 11 years and two months. That is early 2031 if there is no reduction, hence the rising sense of urgency.
For a two-thirds probability of keeping warming below 2 C, the timeline is stretched to over 25 years and six months, which is mid-2045. In both cases, the period will be shorter if emissions have been increasing in 2020 and 2021.
Prompt reductions in emissions would spend the carbon budget over longer periods, which explains the call for reducing CO2 emissions by 45% by 2030 and reaching zero by 2050. This includes deep reductions in other gases, with methane being a significant contributor to emissions.
Climate finance
Developing countries claim that developed countries have already taken their share, and, in addition, are responsible for financial losses and damages from extreme weather events caused by climate change resulting from their past emissions. Although there was no recognition of responsibility for loss and damages, developed countries pledged financial support for adaptation.
The Glasgow Pact urges developed countries to at least double their collective provision of climate finance for adaptation to developing countries from 2019 levels by 2025. Developed countries cannot immediately stop burning fossil fuels but can reduce their own emissions and subsidize the use of better, more efficient technologies that accelerate the shift to renewables in developing countries, hence reducing their reliance on the carbon budget.
However, even though they previously recognized the need to help, developed countries have not yet met a collective pledge to mobilize US$100 billion/year to finance mitigation initiatives by 2020. Section V paragraph 27 of the Pact “urges” them to deliver on the pledge urgently and through 2025.
A benchmark for fairness
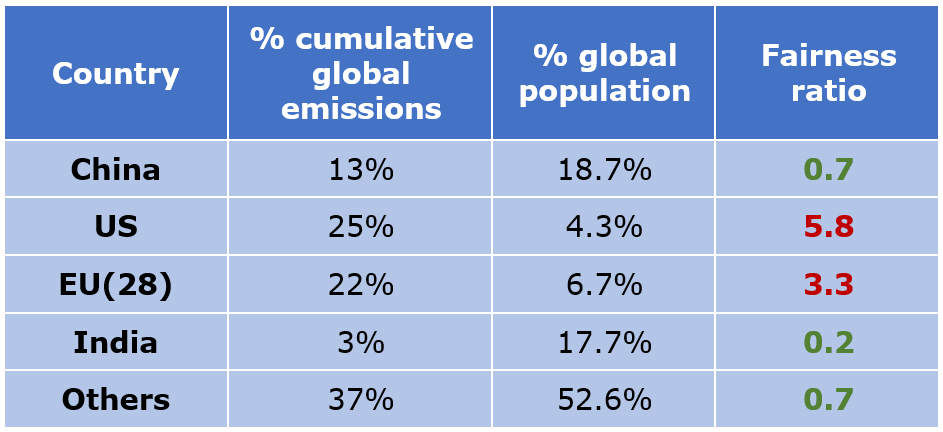
“Fairness” in terms of emissions can be estimated by comparing a country’s percentage of global emissions with its percentage of the global population. A ratio above 1 indicates that a country is emitting more than its fair share and vice-versa.
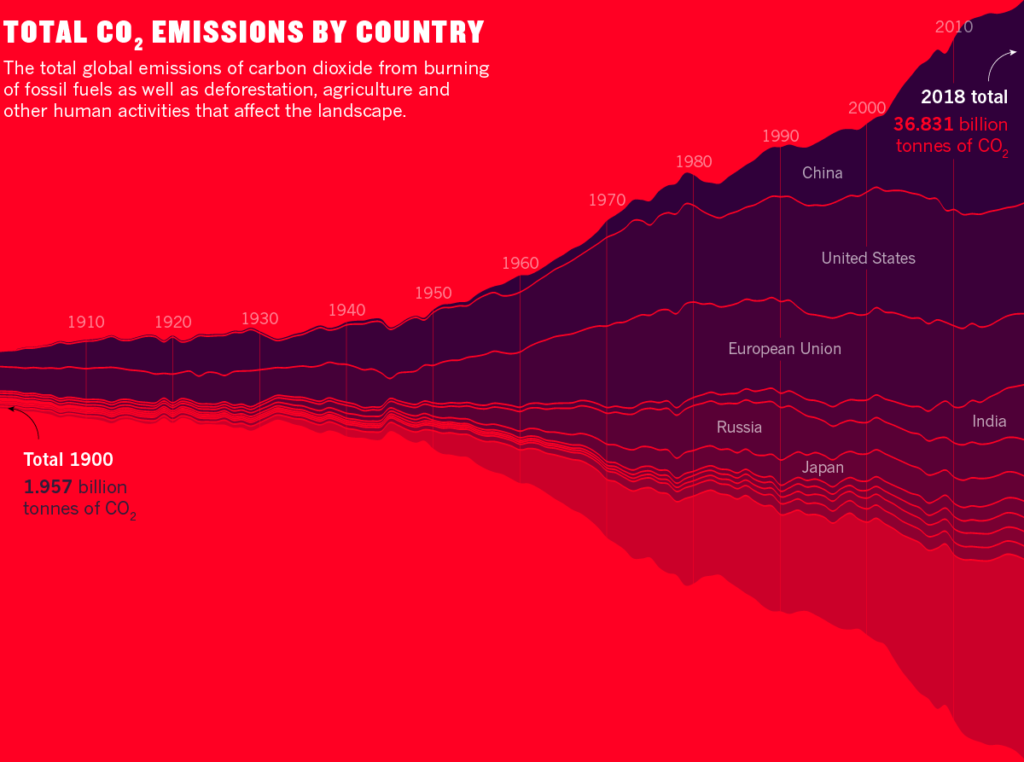
Figure 2 illustrates the historical and current disparities from 1900 to 2018 (which is the latest year for which complete data is available; 2021 would not look much different).
Each area in the chart is proportional to the cumulative emissions from that country or group of countries. The height of each area at the 2018 line indicates that country’s share of the 36.8 billon tonnes of CO2 emitted in 2018 (which are 18.8 times the 1900 emissions or 4.8 tonnes per capita). Since the vertical lines are 10 years apart, it can be seen that the bulk of the CO2 has been accumulated during the last six decades, but at different rates by different countries in successive periods.
The chart shows that China’s past emissions started low but were catching up by the turn of the century, building up to a 13% share of cumulative emissions, as shown in Table 1. This represents about 70% of its fair share of cumulative emissions, since the ratio of 13% of global emissions to 18.7% of the global population is 0.7. The US, on the other hand, was a significant emitter for the whole period and accounts for 25% of cumulative emissions, 5.8 times its share. The EU (before Brexit) fares better at 3.3 with a lower share of cumulative emissions and a larger population. India was a late starter and is still a low emitter, so it has a below average ratio of 0.2. Since both the US and EU have ratios above average, it is not surprising that the rest of the world is also below average!
However, for current (2018) emissions there is a sharp reversal: China becomes the largest emitter, 1.8 times the US, but it has also the largest population, which keeps its ratio at 1.4. A ratio of 3.5 for the US shows that the American per capita figure is 2.4 times that of China’s! The EU is doing marginally better than China with a ratio of 1.3. India’s emissions have increased in recent years but a current ratio of only 0.4 is still well below parity, which explains why it can argue for more flexibility in using the carbon budget to support future economic development. China can argue that even though it is above parity for current emissions, there is still room for catching up on the basis of cumulative emissions. The remaining countries are also catching up but slowly, since their ratio is 0.8 versus a ratio of 0.7 on a cumulative basis. More importantly, it shows the US and the EU continue to increase the imbalance of their cumulative emissions by accumulating each year more that their fair share of CO2.
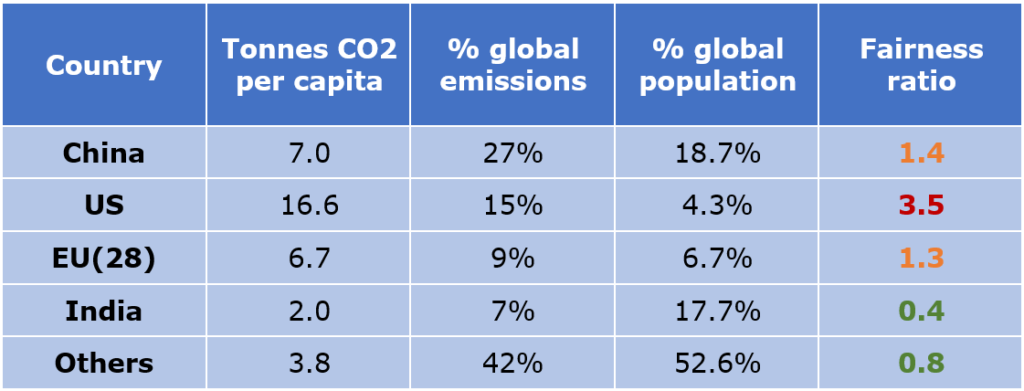
The good news is that, overall, Table 2 shows lower discrepancies than Table 1 as most ratios are closer to 1. However, the last group, “Others”, hides discrepancies since it includes all other developed countries, many of which have ratios over 1, such as Australia, Canada, Japan, and the Gulf countries. Canada for example, with only 0.49% of the global population in 2018 was responsible for 2% of emissions, thus its ratio was 4.1. It has since committed to achieving net zero emissions by 2050 and in July 2021, submitted a stronger NDC target for COP 26: it will now cut emissions by at least 40-45% below 2005 levels by 2030, up from the previous target of 30%. Canadian actuaries can support the new national climate policy by applying their risk management expertise to help optimize its implementation. For example, increasing the transparency and accuracy of climate-related financial disclosure and ESG reporting will help decision makers make more sustainable choices.
Flawed data is not fact based
There are discrepancies in reported data and a significant deficit has been identified in Glasgow between the 44.2 billion tons of CO2 reported by countries and estimates from other reliable sources. The gap is large, 8.5–13.5 billion tons, over 30% at the high end, and is a serious handicap in searching for climate justice.
Fortunately, the remedy is on its way since a major achievement of COP 26 has been the completion of the Paris Rulebook. By 2024, all countries will have to report detailed data on their GHG emissions in accordance with common methodologies, modalities, and procedures.
It is expected that climate finance will dominate discussions in Sharm el-Sheikh as negotiations during COP 27 will need to address not only the subsidies from developed to developing countries for mitigation and adaptation as mentioned above, but also the mobilization of public and private investments in new technologies to develop renewable energy sources and the financing of an accelerated decarbonization of the economy.
While climate-related physical risks for this decade and the next remain largely driven by past emissions, actuaries may need to consider their impact on decisions by investors and policymakers seeking to manage transition risks through adaptation or mitigation initiatives.
Yves Guérard, FCIA, FSA, Hon. FIA, PhD (hc), retired in 1999 but has remained active on the international scene. From 1997 to 2010 he was secretary general of the International Actuarial Association and a member of its Climate Risk Task Force since August 2019. He represents Canada on the Actuaries Climate Index Working Group. From 1984 to 1990 he served on the Economic Council of Canada and from 1997 to 2015 he served on the Panel of Senior Advisors to the Auditor General of Canada.
This article reflects the opinion of the author and does not represent an official statement of the CIA.