
By Assia Billig, FCIA, FSA; Christine Dunnigan, FCIA, FSA; and Jackie Ruan, FCIA, FCAS
By the end of July 2023, wildfire had already burned about 13.3 million hectares in Canada for the year, more than six times the 10-year average and forced more than 120,000 people to evacuate their homes. Nova Scotia had three months’ worth of rain over the course of one day, which flooded the province, forced evacuations and left at least four people missing. From a more global perspective, July 2023 was the hottest month ever recorded on Earth, according to the European Union’s climate observatory. These heatwaves could have devastating consequences, as shown in the 2023 analysis published in Nature Medicine. Based on this analysis, it is estimated that more than 61,600 people died from heat-related causes across 35 European countries from late May to early September 2022.
These severe weather events, affecting many different aspects of our lives, are likely to become more frequent or more intense with climate change according to scientific studies. Given its potential significant impact on our environment, economy and social well-being, the Office of the Chief Actuary (OCA) has included an analysis to assess the future potential downside impact from climate change in the “31st Actuarial Report on the Canada Pension Plan” as at December 31, 2021 (CPP31 AR), which was tabled before the House of Commons in December 2023.
The OCA is among the first to publicly illustrate in an actuarial report the impact of climate risk on the sustainability of a social security system.
The purpose of this article is to provide more information on the analysis that was performed by the OCA in this respect. Background information on the OCA and the CPP is provided in the box below.
The Office of the Chief Actuary and the Canada Pension Plan
The OCA, as an independent unit within the Office of the Superintendent of Financial Institutions (OSFI), provides advisory services to the Government of Canada. As part of its mandate, the OCA conducts statutory actuarial valuations for federal public sector employee pension and insurance plans, and a range of Canadian social security programs (CPP, Old Age Security program, Canada Student Financial Assistance Program and Employment Insurance Program). In this context, the OCA prepares actuarial reports on the Canada Pension Plan (CPP or the Plan) at least every three years.
The CPP is a mandatory earnings-related defined benefit plan aimed at providing basic retirement income. It is funded through contributions by employers and employees. Since January 1, 2019, the CPP was enhanced through the introduction of the additional CPP, which increased the maximum benefit level from one-quarter to one-third of average covered work earnings as well as the level of covered earnings. Thus, the CPP now consists of two parts: the base CPP (benefits in existence prior to the enhancement) and the additional CPP. The base CPP is partially funded while the additional CPP is fully funded. The CPP covers Canadian workers throughout Canada, except in Quebec, where the Québec Pension Plan (QPP) provides similar benefits.
The CPP is directed by the Canada Pension Plan (CPP Act) and corresponding regulations. It is jointly governed by federal, provincial and territorial ministers of finance who act as stewards for the Plan and represent the interest of CPP contributors and beneficiaries. The actuarial reports prepared by the OCA are considered by the joint stewards who are responsible for reviewing the financial state of the CPP and making recommendations on the CPP every three years.
The actuarial reports provide the minimum contribution rates (MCR) of the base and additional CPP, which are compared with their respective legislated contribution rates. In CPP31 AR, the minimum contribution rate for the base CPP is 9.56% for years 2025 to 2033 and 9.54% for years 2034 and thereafter. This compares to the legislated contribution rate of 9.9%. The first and second additional minimum contribution rates for years 2025 and thereafter for the additional CPP are 1.97% and 7.88%, respectively. This compares to the legislated contribution rates of 2.0% and 8.0%, respectively.
The MCRs are important legislated measures that are used to assess the sustainability of each component of the CPP. If the MCRs fall outside of certain ranges relative to the legislated contributions rates, automatic adjustments to contributions and/or benefits may apply. The framework for the base CPP and additional CPP is different. For example, in the case of the base CPP, insufficient rates provisions would be activated in cases where the MCR is higher than the legislated contribution rate of 9.9% and the stewards do not agree on a course of action.
The legislated methodology to determine the MCRs requires projections of revenues, expenditures, investment income and assets for a period of over 75 years. Given the length of the projection period and the number of assumptions required, differences relative to the best-estimate projections are to be expected.
The actuarial reports prepared by the OCA therefore include information to illustrate the sensitivity of the MCRs to changes in the future demographic, economic and investment outlooks. For the CPP31 AR, a new section was also added to illustrate downside risk due to potential and emerging trends, with climate change being part of this section.
Context for considering climate change
Climate change risks have been ranked among the top emerging risks globally, and they are generally classified into two categories: physical risks, which are linked to the increase in the frequency and severity of climate events, and transition risks, which are linked to efforts undertaken for a transition towards a lower carbon economy. It is also important to note that regardless of the transition path, full elimination of physical risks is not realistic at this point given that a certain level of physical risk is already embedded from past global warming. However, physical risks may be reduced or mitigated if new technologies are developed that reduce and/or capture carbon emissions.
Since such technologies are not readily available yet, there is general consensus that climate change will have an overall negative impact on society and the economy worldwide. Given the magnitude of the potential socio-economic impacts, climate change may also have an impact on social programs such as the CPP.
Climate change can affect the CPP through various channels as the demographic, economic and investment environments can all be affected by climate change in the future. However, there is a lot of uncertainty on the direction and magnitude of these potential impacts, and the risk is evolving constantly. In addition, research and data to quantify the full impact of climate change on the demographic, economic and investment environments are incomplete and, in certain cases, somewhat conflicting.
In view of the high level of uncertainty, scenario analysis is used to illustrate climate risk in CPP31 AR as an alternative to incorporating future climate policy and the potential impact of technology into best-estimate assumptions. The analysis included in the CPP31 AR assesses the climate-related downside risks by looking at the potential changes in the MCR of the base CPP under different hypothetical climate scenarios. Since the additional CPP is still at its early stages, it is not part of the analysis.
It is important to note that the analysis focuses on assessing downside risk only, and that it is based on scenarios that are intentionally adverse. New technologies and business opportunities related to a transition to a lower carbon economy may also create positive outcomes that are outside the scope of the analysis; it is therefore not meant to represent forecasts or predictions.
Hypothetical illustrative climate scenarios
Over the last few years, many global organizations and national regulators such as OSFI have been conducting climate scenario analyses and publishing the results of their findings.
For assessing climate risk in CPP31 AR, given the complexity of climate models and the level of expertise required to develop them, it was decided to use information that was available to the OCA, from either publicly available or private sources, to develop hypothetical climate scenarios and to estimate the Minimum Contribution Rate (MCR) under each of these scenarios.
One important variable that is often analyzed in these available scenarios is the gross domestic product (GDP). It has the advantage of being a well understood and broadly used measure. Conceptually, it is also an overarching macro-economic variable that can be used to adjust the future economic and investment environment. It was therefore decided to focus on GDP impacts in the selection of the hypothetical climate scenarios.
An overview of the available information shows a wide range of climate scenarios with a corresponding wide range of GDP impacts. The differences in scenarios can sometimes make it difficult to compare impacts and draw conclusions. One way of consolidating this information into a similar basis is by using some commonly accepted climate scenarios, such as the Representative Concentration Pathway (RCP) scenarios introduced in the 5th assessment report of the Intergovernmental Panel on Climate Change (IPCC), and the Shared Socioeconomic Pathway (SSP) scenarios introduced in the 6th IPCC assessment report.
The RCP scenarios are designed to provide plausible future scenarios of anthropogenic forcing spanning a range of scenarios with low to high emissions in 2100 (RCP 1.9, 2.6, 4.5, 6 and 8.5, respectively). The SSP scenarios focus on modelling socioeconomic factors such as population, economic growth, education, urbanization and the rate of technological development. They are designed to reflect the worlds in which mitigation and adaption challenges vary from low to high (SSP 1, 2, 3, 4 and 5, respectively).
Using the narratives of the RCP scenarios and the SSP scenarios provided by the IPCC, the climate scenarios from various sources were categorized into groups. For each of these groups of climate scenarios, ranges of potential cumulative GDP impact were obtained using the information from the reviewed sources. These ranges of GDP impact for each group of climate scenarios were used as a reference point for developing the hypothetical climate scenarios used in the CPP31 AR.
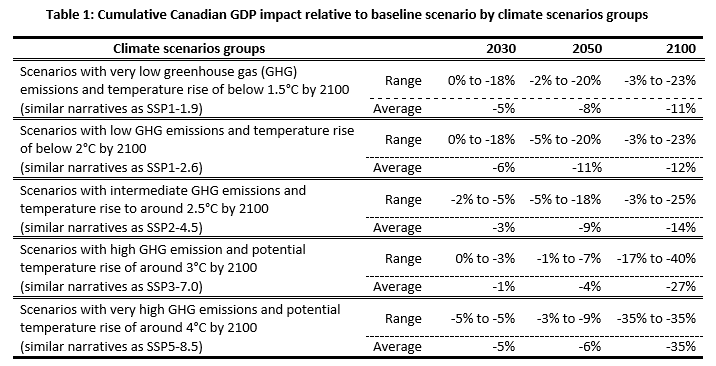
Table 1 below shows the climate scenarios categorized in groups from the sources that were reviewed when preparing CPP31 AR (references are provided at the end of this article), as well as the corresponding estimated cumulative Canadian GDP impact in 2030, 2050 and 2100. The ranges of GDP impact for each group are determined using the minimum and maximum GDP impact estimated in the reviewed sources. It can be seen that the ranges of GDP impact can be wide even within similar scenario narratives. This highlights the level of uncertainty and wide range of views.
Based on the information shown above, three hypothetical climate scenarios were developed for the purposes of illustrating downside risk in CPP31 AR. They each have a different pathway of Canadian GDP growth rates relative to a baseline scenario. The baseline scenarios in the reviewed sources exhibit variability and lack clear definition, hindering their direct comparison with the best-estimate assumptions of the CPP31 AR. For illustration purposes only, differences from these baseline scenarios were applied to the best-estimate assumptions of the CPP31 AR.
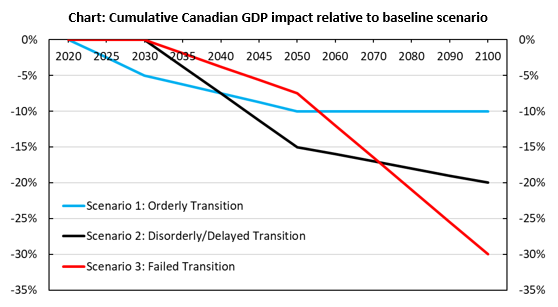
- Scenario 1 can be generally classified in the “orderly transition” category of scenarios, which has narratives that are closest to the scenarios listed in the first row of Table 1 above. It therefore assumes that successful climate policies are introduced early and gradually in order to limit global warming. Canadian GDP growth rates are lower relative to the baseline scenario over the whole projection period, mainly caused by disruption in the economy from implementation of climate change policies. The cumulative difference in GDP projections relative to the baseline scenario grows to -10% by 2050, then stays constant until 2100.
- Scenario 2 can be generally classified in the “disorderly/delayed transition” category of scenarios, which share narratives close to the scenarios in the second and third group (the second and third rows of Table 1 above). It assumes that climate change policies only start in 2030. There is therefore no impact on GDP relative to the baseline scenario until 2030. However, late action leads to a stronger impact than scenario 1 after 2030. The cumulative difference relative to the baseline scenario is 0% by 2030, -15% by 2050 and -20% by 2100.
- Scenario 3 can be generally classified in the “failed transition” category of scenarios, which share narratives close to the ones of scenarios in the last two groups (fourth and fifth rows of Table 1 above). It assumes that no further climate change policies are implemented. Although the difference relative to the baseline scenario is lower than the other scenarios through 2050, the compound physical risks resulting from no further climate action creates severe impacts between 2050 and 2100. The cumulative difference relative to the baseline scenario is 0% by 2030, -8% by 2050 and -30% by 2100.
The chart below shows the differences in cumulative Canadian GDP growth rates relative to the baseline scenario for each of the hypothetical climate scenarios used in CPP31 AR.
Estimating the impact of hypothetical climate scenarios on base CPP sustainability
As mentioned previously, the sustainability of the base CPP is most commonly assessed through the MCR and how it compares to the legislated contribution rate of 9.9%. To assess climate-related risks in CPP31 AR, the hypothetical climate scenarios above are translated into potential impacts on the base CPP MCR, using the following simplified approach:
- Changes in Canadian GDP growth are translated one-for-one into changes in total
employment earnings growth through the real wage assumption. (Lower GDP translates directly into lower productivity and real wages.)
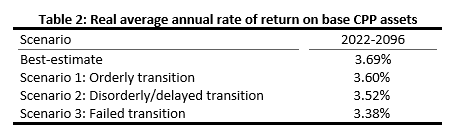
- Changes in global GDP growth are also incorporated in the assumed investment returns
through the growth in earnings component, which is proxied by global GDP per capita growth. The growth in earnings is used to develop the assumption on rates of return on public equities, private equities and real assets.
In 2030, these three asset classes are expected to represent 73% of the CPP investment portfolio. For simplicity, changes in global GDP growth were proxied by the changes in Canadian GDP growth shown in the chart. Table 2 below shows the assumed average annual real rate of return for each scenario for the 75-year period of 2022-2096.
This simplified model allows for an initial assessment of climate change risk on the base CPP. The OCA will conduct further research in the future and collaborate with other professionals on the topic with the objective of refining the model as well as incorporating other relevant variables and their dynamics.
Results
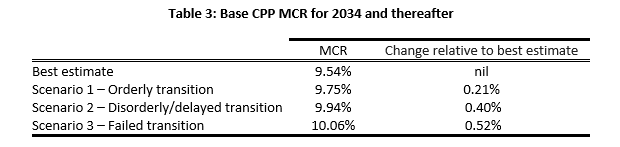
The resulting impact on the base CPP MCR for each scenario is shown in Table 3 below, as well as the comparison relative to the base CPP MCR under the best-estimate assumptions. In the CPP31 AR, the MCR for the base CPP is 9.56% for years 2025-2033 and 9.54% for year 2034 and thereafter.
It is important to note that these scenarios are intentionally adverse. They are meant to illustrate downside risk only and are not meant to be forecasts or predictions.
Conclusion
For the first time, the OCA assessed in the CPP31 AR the potential impact from climate change on the sustainability of the CPP. The OCA is among the first to publicly illustrate in an actuarial report the impact of climate risk on the sustainability of a social security system.
Under the orderly transition scenario, the MCR was estimated to increase to 9.75% (representing an increase of 0.21% compared to the best-estimate), which is still lower than the legislated contribution rate of 9.9%. However, the MCR is estimated to increase to 9.94% and 10.06% for the disorderly/delayed transition scenario and the failed transition scenario, respectively (increases of 0.40% and 0.52% compared to the best-estimate). Both result in the MCR being higher than the legislated contribution rate.
Using available public and private data, three hypothetical climate scenarios were developed to reflect different levels of exposures to physical and transition risks arising from climate change.
There are currently many uncertainties around climate change due to a number of ever-changing factors that interact with one another in a complex system. Our understanding of Earth’s systems and their interactions remain incomplete, the climate policies that will be implemented by the countries around the world are difficult to predict, and significant technological advancements in clean energy and carbon capture have yet to be seen.
The present analysis is intended to reflect the future potential downside risk of climate change on the CPP based on OCA’s latest understanding on the issue. The OCA is committed to enhance its knowledge and understanding of climate-related risks as they relate to the sustainability of social insurance programs and public pension plans.
References
IAA Climate Risk Task Force. (2020). “Importance of Climate-Related Risks for Actuaries,” International Actuarial Association.
Institute and Faculty of Actuaries (IFoA). (2020). “Climate Scenario analysis for pension schemes.”
International Monetary Fund (IMF). (2020). “Global Financial Stability Report: Markets in the Time of COVID-19; Chapter 5: Climate Change: Physical Risk and Equity Prices.” April 2020.
Mercer. (2019). “Investing in a Time of Climate Change.”
Network for Greening the Financial System (NGFS). (2021). “NGFS Climate Scenarios for central banks and supervisors.”
Bank of Canada and Office of Superintendent of Financial Institutions. (2022). “Using Scenario Analysis to Assess Climate Transition Risk – Final Report of the BoC-OSFI Climate Scenario Analysis Pilot.”
Schroders. (2022). “Climate Change and financial markets: Part 1.”
Schroders. (2022). “30-year return forecasts (2022-51): Part 2.”
Swiss Re. (2021). “The economics of climate change: no action not an option.”
McKinsey & Company. (2022). “The net-zero transitions: What it would cost, what it could bring.”
Semieniuk, Holden, Mercure, et al. (2022). “Stranded fossil-fuel assets translate to major losses for investors in advanced economies.” Nature Climate Chang. Vol. 12: 532-538.
This article reflects the opinion of the authors and does not represent an official statement of the CIA.