By Christine Chui, FCIA, André Choquet, FCIA, and Yves Guérard, FCIA, members of the CIA Climate Change and Sustainability Committee
As detailed in a previous article, the ACI provides objective measures of specific and aggregate changes in climate extremes and sea level across Canada and the US and is based on an analysis of seasonal data from neutral, scientific sources for six index components collected since 1961. These components include:
- frequency of extreme high temperatures;
- frequency of extreme low temperatures;
- frequency of high winds;
- the maximum amount of heavy precipitation in the month;
- the longest period of consecutive dry days in the last 12 months; and
- change in sea level.
Data collected from each component contributes to the combined ACI with equal weight, but the sign for the frequency of low temperature is reversed. Additional details on each component can be found on the ACI website.
The ACI does not refer to the cause of climate changes nor predict future changes; rather, it summarizes historical events. A higher ACI means the difference with the reference period is more significant from a statistical point of view.
How are the ACI values estimated?
The most quoted ACI value is the rolling average over the last 20 seasons for the US and Canada in aggregate. ACI values are available for Canada and the US separately and for each of the seven US and five Canadian regions. Note that the USC is not a weighted average of the US and Canada, but a metric recalculated for the statistical universe comprising the 12 regions. The same is true for aggregating the regions into countries. More granularity is also available for the time scale, down to seasons and months.
Where does data come from?
The ACI values are derived based on data collected from an extensive network of meteorological stations and coastal tide stations within the United States (excluding Hawaii and unincorporated United States territories) and Canada.
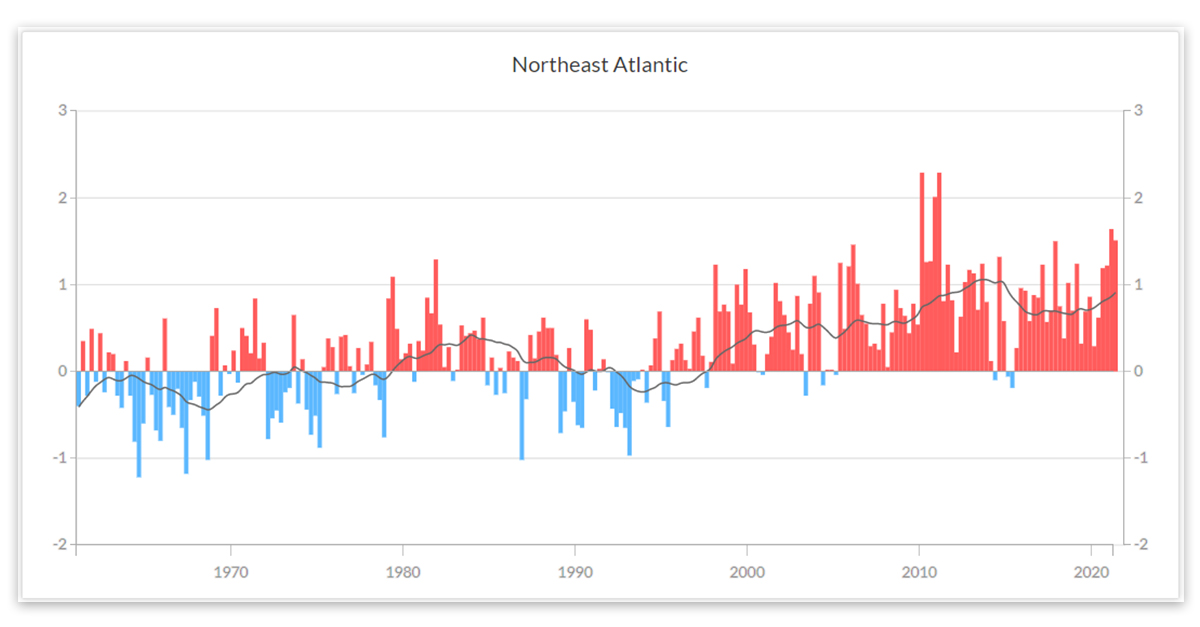
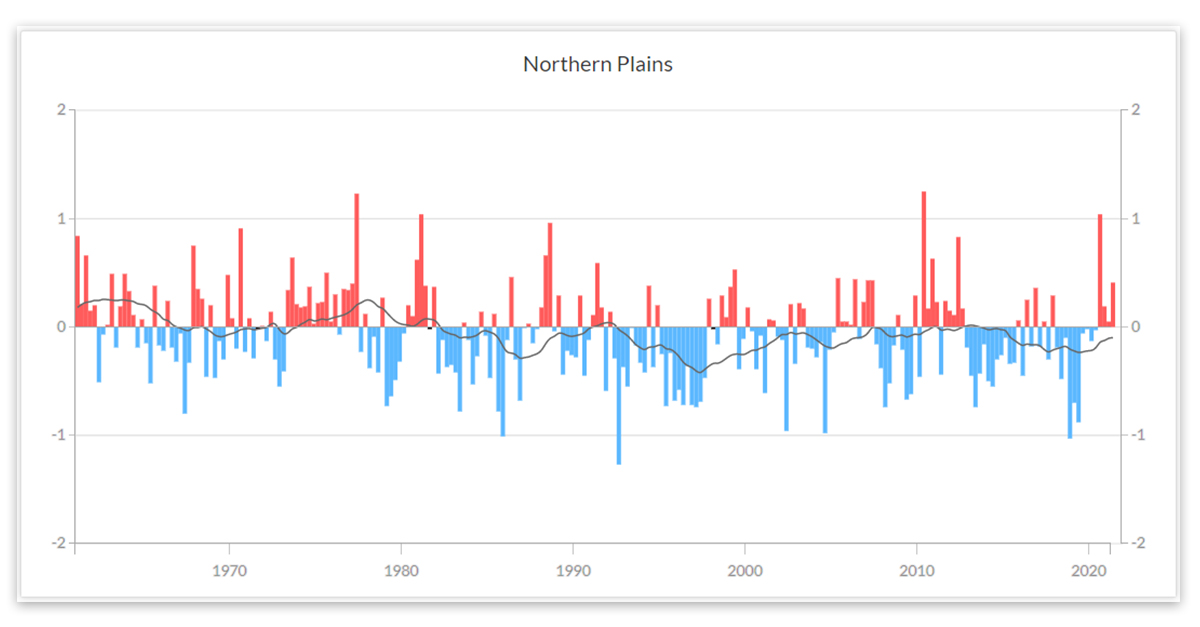
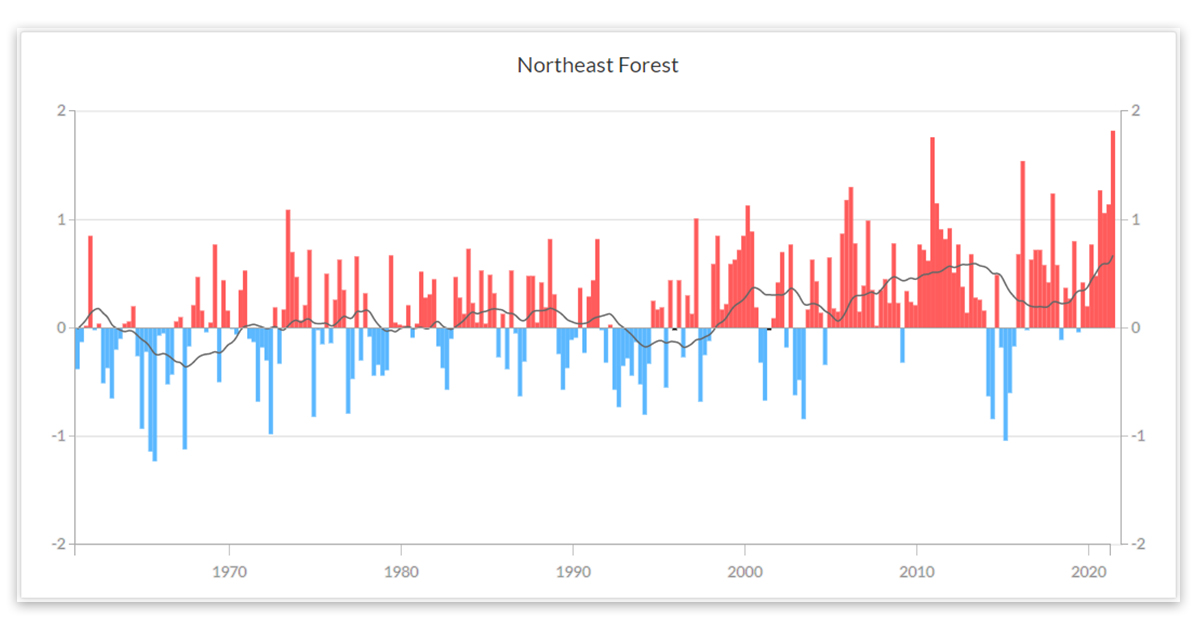
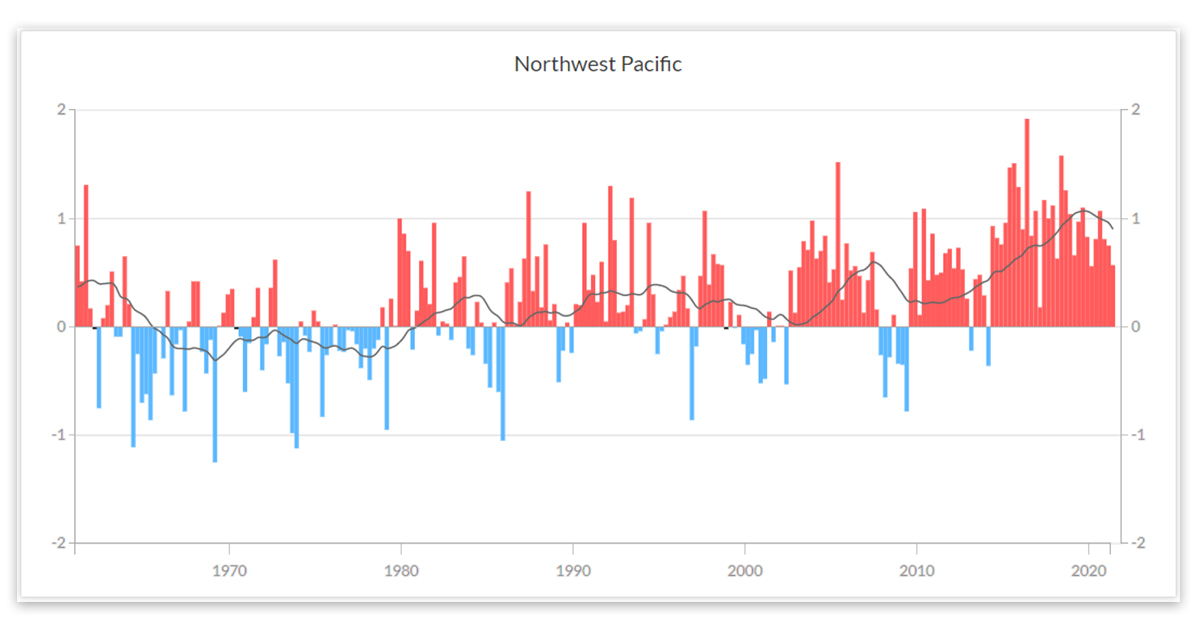
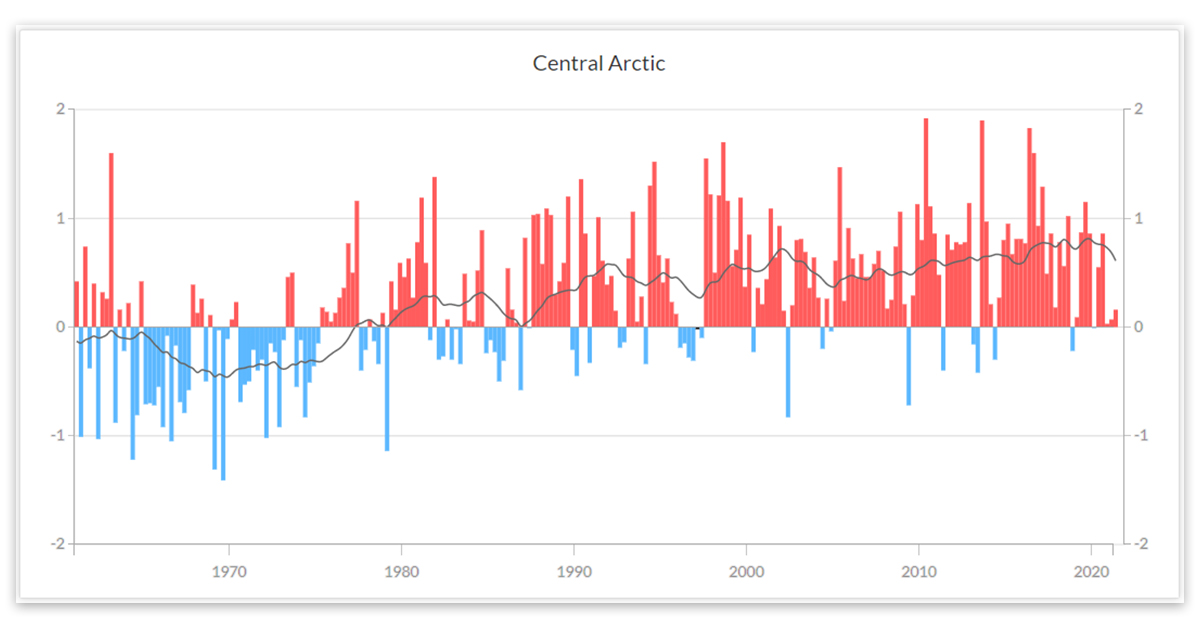
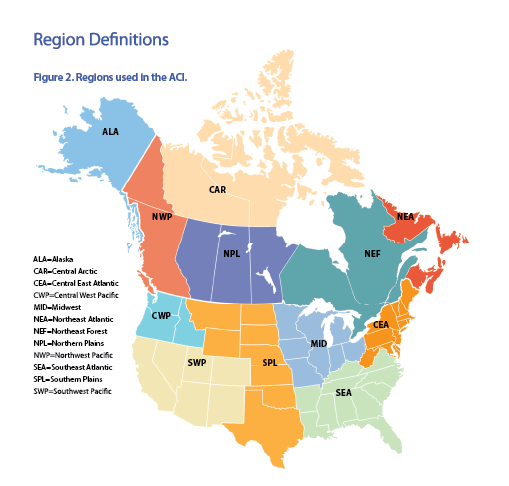
Canadian data is collected from five different regions, Northwest Pacific (NWP), Central Artic (CAR), Northern Plains (NPL), Northeast Forest (NEF), and Northeast Atlantic (NEA):
For sea level, because those stations included in the analysis are sparser than the meteorological stations used to produce the grid data for the other components, values for missing data are estimated by interpolation and extrapolation. In addition, sea level data pertains to coastal regions only as there is no measurement of water levels inland associated with floods.
Due to a reduction in the number of weather stations operating in Northern Canada, data collected did not provide stable geographic coverage. To address this issue, the methodology was altered in April 2019 by introducing a new calculation step: before running the ACI calculation process, we first filter out grid points that are unstable across time, leaving us with a stable set of grid points for which each month’s data has been available at least 90 per cent of the time in each decade from 1960 to the present. The restated ACIs generally reduced slightly, but a gradual upward trend across the last 20 years remained the same.
Where is the Canadian ACI trending?
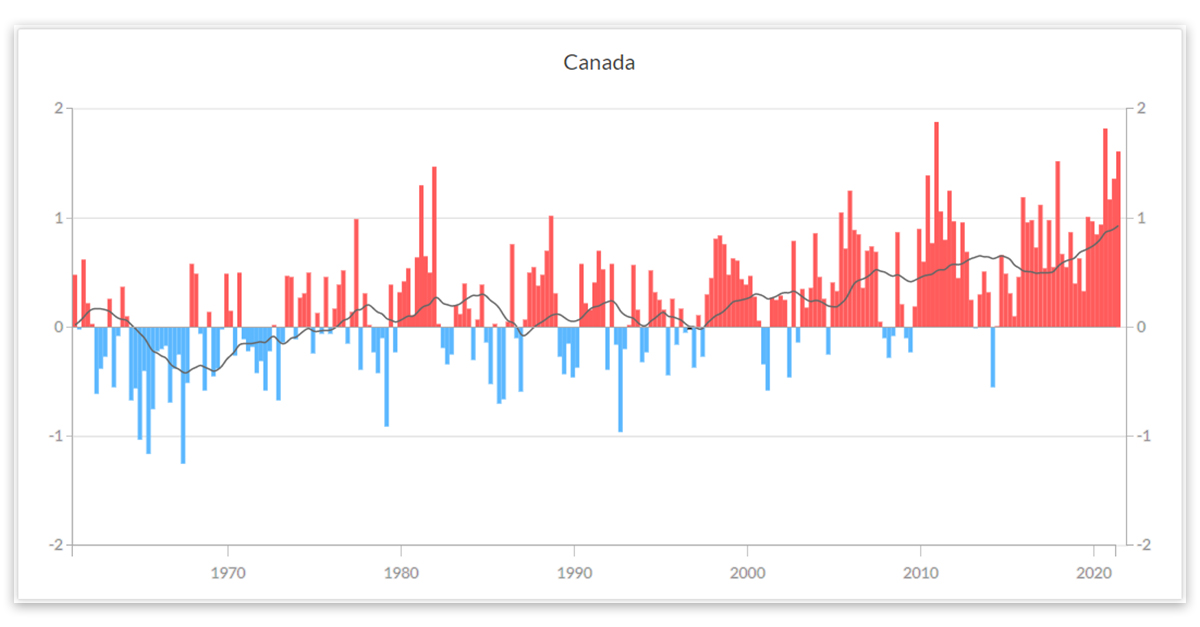
The Canadian ACI values are populated based on data collected from the five regions noted above. Both the Canadian and US ACI exhibit similar upward trends. This graph shows the five-year rolling average for the Canadian ACI as a black line with seasonal values represented by vertical bars:
ACI graphs for the five Canadian regions: